Investment and Financing Decisions
Capital budgeting decision (investment decision / CAPEX decision)
- Whether to invest in tangible assets: airplane, and intangible assts: R&D Financing Decision
- source/amount of financing → debt or equity In simple terms: budgeting is buying things and financing is borrowing money
Real assets: assets used to produce goods Financial assets: claims to the income generated by the firm’s real assets
Agency Problem
The agency problem occurs when a manager (agent), who is hired to run a business, acts in their own interest instead of the owner’s (principal’s) interest. This conflict arises in corporations where shareholders own the company but hire executives to manage it.
For example, a CEO might approve expensive corporate jets for personal comfort, even though shareholders prefer cost-cutting to increase profits. This misalignment can be reduced through performance-based incentives, audits, and better corporate governance.
| Feature | Limited Liability Corporation (LLC) | Partnership | Professional Corporation | Sole Proprietorship |
|---|---|---|---|---|
| Ownership | One or more members | Two or more partners | Licensed Professionals (eg. lawyers, doctors, etc.) | One individual |
| Owner’s Liability | Limited | Unlimited | Limited | Unlimited |
| Taxation | Pass-through or corporate tax | Pass-through taxation | Can be pass-through or corporate tax | Pass-through taxation (owner pays personal income tax) |
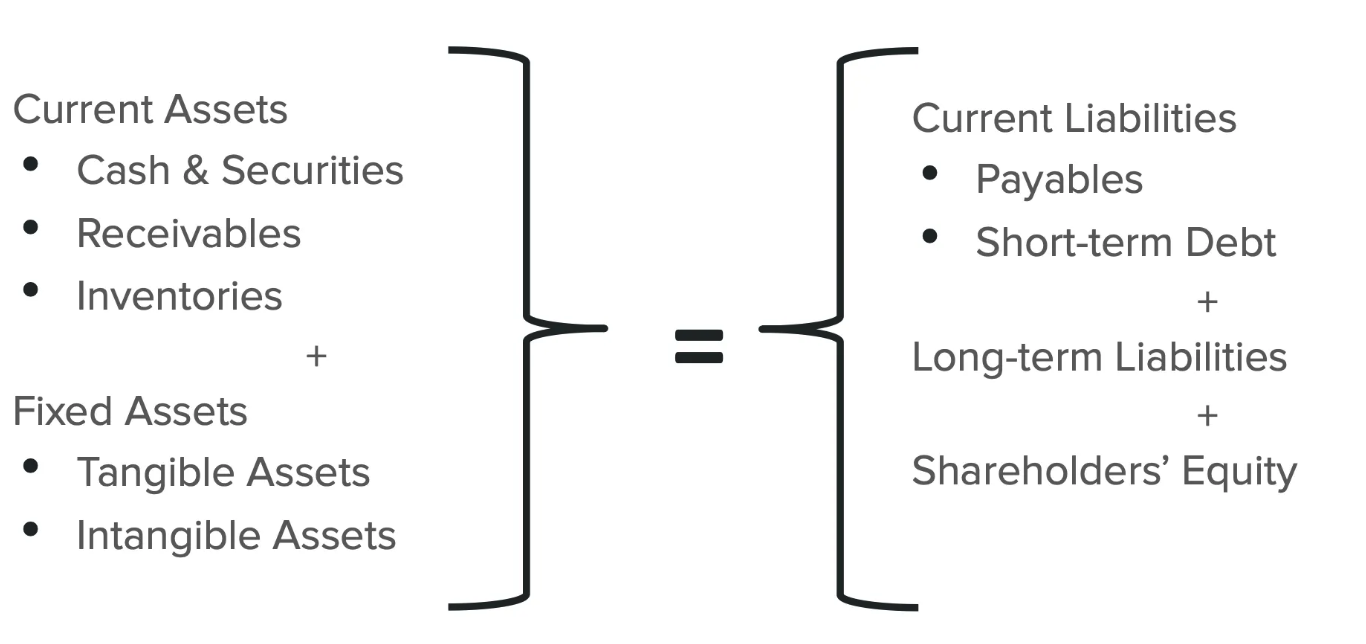
Balance Sheet Items
| Term | Formula |
|---|---|
| Shareholder’s Equity | Total assets - Total Liabilities |
| Net Working Capital | Current Assets - Current Liabilities |
| Net Income | Taxable Income - Taxes |
| Taxable Income | Total Revenue - Cost - Operating Expense - Deductions |
| Earnings Before Interest and Taxes (EBIT) | total revenues + other income - costs - depreciation |
| Free Cash Flow | Net Income + interest + depreciation - additions to net working capital + Cashflow from Investments Interest + Cashflow from Operations + Cashflow from Investments Cash available for distribution to investors after firm pays for new investments or additions to working capital. |
| Cash flow source | |
|---|---|
| Cash from Operations | Day to day ops |
| Cash from Investments | Investment in assets |
| Cash from Financing Activities | People investing in u (banks) |
| Note: Capital expenditure is a long term investment (ie. buying a new factory | |
| ) |
Market Value Metrics
| Metric | Formula |
|---|---|
| Market Capitalisation | shares * price per share |
| Market Value Added | Market capitalisation - equity |
| Market to Book Ratio | Market value of equity : Book value of equity |
| Total Capitalization | Long term debt + equity It represents the total amount of money that has been raised to finance its operations |
| After tax operating income | Net income + (1 - tax) x interest expense OR EBIT x (1 - tax) |
| Economic Value Added | After tax operating income - (cost of capital * total capitalization) Net income minus a charge for the cost of capital employed; also called residual income. EVA shows whether a company is truly creating value beyond its costs, including the returns expected by investors. |
| Return on Capital (ROC) | ROC tells you how efficiently a company is using the money that investors and lenders have put into it. |
| Return on Assets (ROA) | If a company owns factories, equipment, and cash in the bank (all assets), ROA tells you how well it’s using everything it owns to generate profit. Can also be calculated using asset turnover x operating profit margin |
| Return on Equity (ROE) | Measures how efficiently a company turns shareholder investment into profit. It tells you, “For every $1 of shareholder money, how much profit does the company generate?” 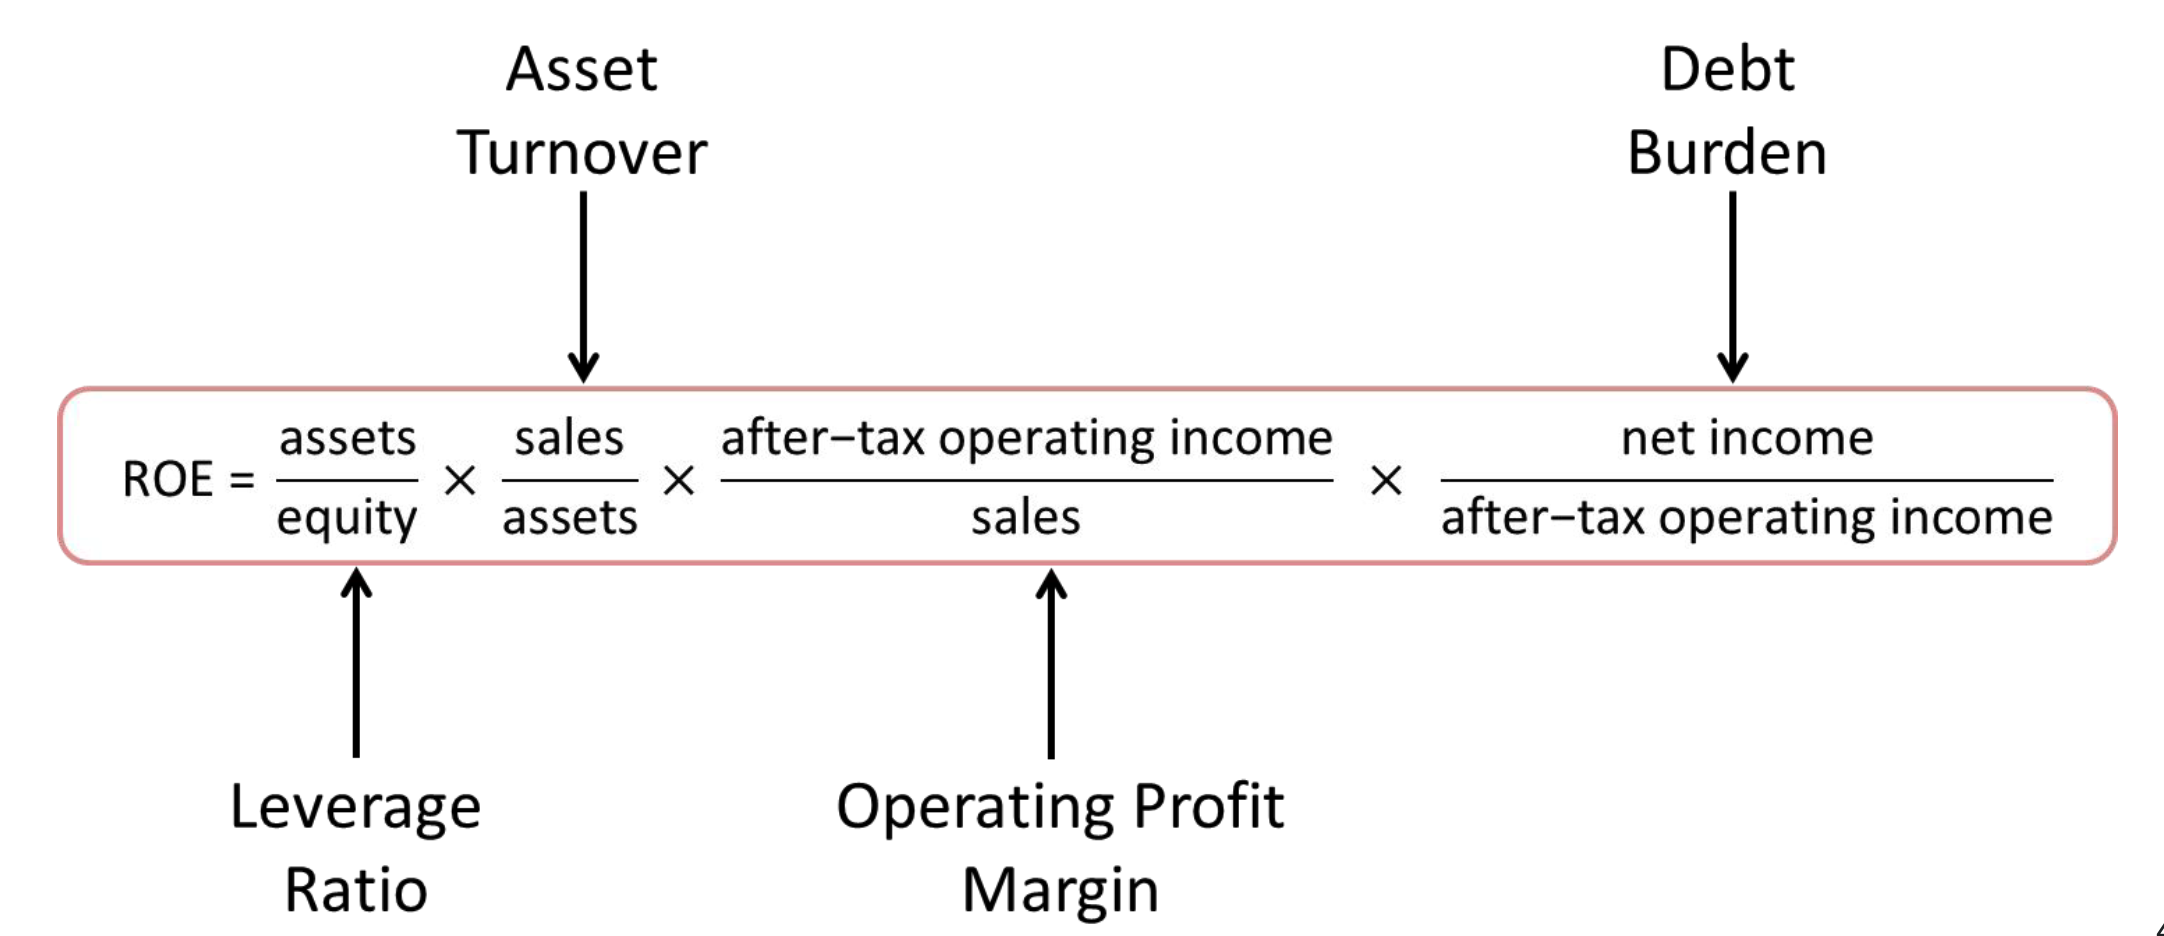 |
| Asset Turnover Ratio | OR Measures how efficiently a company uses its assets to generate sales. A higher ratio means better asset utilization. |
| Inventory Turnover Ratio | Shows how quickly a company sells and replaces its inventory. A high ratio indicates efficient inventory management. |
| Average Days in Inventory | Indicates how many days, on average, inventory sits before being sold. Lower values suggest faster turnover. |
| Receivables Turnover | Measures how efficiently a company collects money from customers. A high ratio means customers pay quickly. |
| Average Collection Period | Tells how many days, on average, customers take to pay their bills. A shorter period means faster cash inflow. |
| Long-term debt ratio | Shows the proportion of a company’s long-term financing that comes from debt rather than equity. |
| Long-term debt equity ratio | Compares long-term debt to shareholders’ equity, indicating financial leverage and risk. Higher values mean more reliance on debt. |
| Total debt ratio | Measures how much of a company’s assets are financed by debt. A higher ratio means more financial risk. |
| Times interest earned | Indicates how easily a company can cover its interest payments with its earnings before interest and taxes (EBIT). Higher values are better. |
| Cash coverage ratio | A stricter version of the interest coverage ratio that includes depreciation, showing a company’s ability to pay interest with available cash flow. |
| Net working capital to total assets ratio | 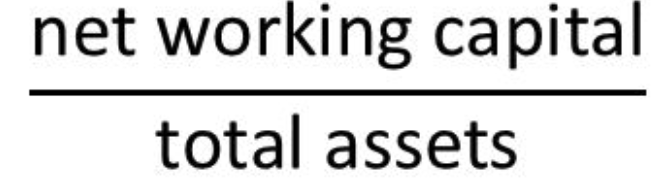 Net Working Capital is the difference between assets and liabilities Shows how much of a company’s total assets are financed by its short-term assets (working capital). Higher ratios indicate more liquidity. |
| Current ratio | 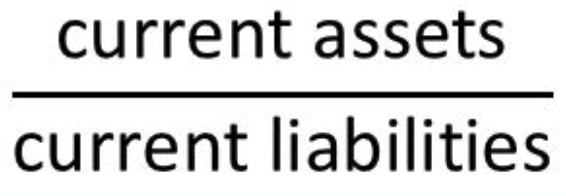 Measures a company’s ability to pay short-term debts with its short-term assets. A ratio above 1 indicates good liquidity. |
| Quick ratio |  (Current Assets - Inventory) / Current Liabilities A stricter liquidity measure that excludes inventory, showing how well a company can meet short-term obligations without selling inventory. |
| Cash ratio |  The most conservative liquidity measure, showing the ability to pay short-term debts using only cash and near-cash assets. |
Market Value Metrics: Drawbacks
- The market value of the company’s shares reflects investors’ expectations about future performance.
- Market values fluctuate because of many risks and events that are outside the financial manager’s control. Thus, market values are noisy measures of how well the corporation’s management is performing
- You can’t look up the market value of privately owned companies whose shares are not traded. Nor can you observe the market value of divisions or plants that are parts of larger companies.
Advantages of EVA
- EVA recognises that companies need to cover their opportunity costs before they add value.
- EVA makes the cost of capital visible to operating managers. There is a clear target: Earn at least the cost of capital on assets employed.
- A plant or divisional manager can improve EVA by reducing assets that aren’t making an adequate contribution to profits.
Disadvantages of EVA
They show current performance and are not affected by all the other things that move stock market and we use book values.